Imagine you have built an AI customer support chatbot called ShopAssist.
A customer asks:
Can I return my headphones after 45 days?
The chatbot gives an answer, but the answer is wrong.
At the same time, some users complain that responses are taking 15 seconds, while your AI costs have suddenly increased.
You know something is wrong, but where do you start?
Is the problem with retrieval? The vector database? The prompt? The LLM? Or a tool the AI is calling?
This is where AI observability becomes important.
What is AI observability?
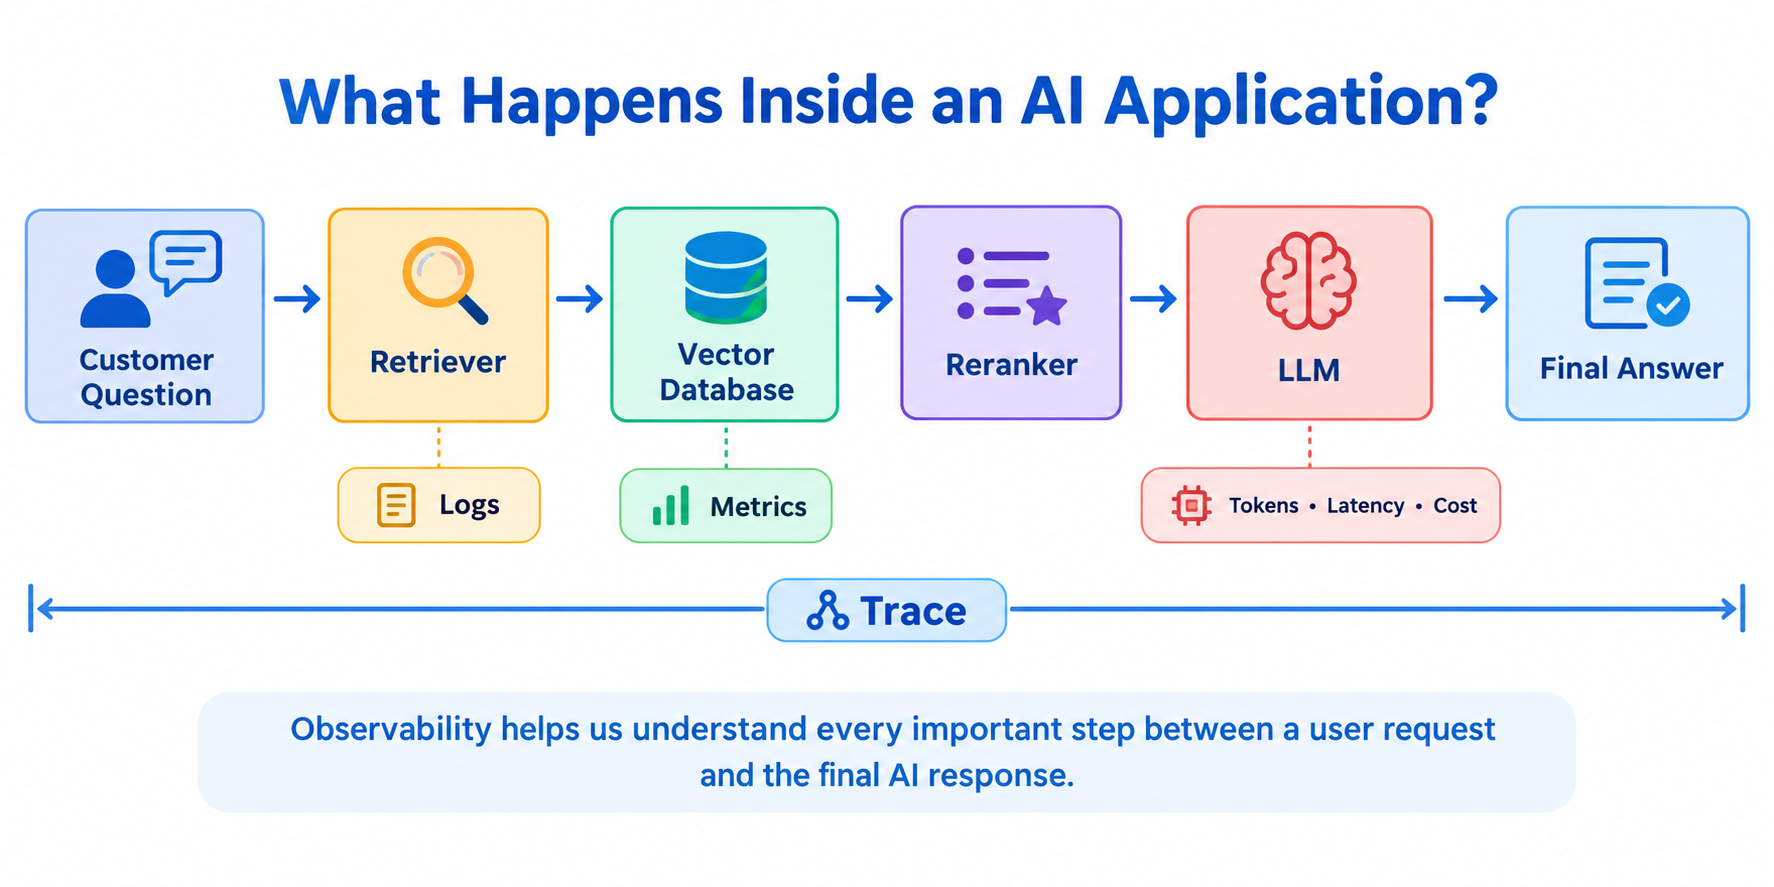
AI observability helps us understand what happens inside an AI application by collecting information about its behavior.
Consider a RAG application:
Customer Question
↓
Retrieve Documents
↓
Build Prompt
↓
LLM
↓
Final Answer
Without observability, you might only see:
Question → Wrong Answer
With observability, you can investigate what happened between the question and the answer:
Customer Question
↓
Retriever
↓
Retrieved old return policy
↓
LLM
↓
Wrong Answer
The important insight is that the LLM may not be the real problem. The system retrieved outdated information.
AI observability helps answer questions such as:
- What happened?
- Where did it happen?
- Why did it happen?
- How long did it take?
- How much did it cost?
Monitoring vs observability
Monitoring tells us that something is wrong.
Observability helps us understand why.
Suppose your dashboard shows:
Error Rate: 12%
Monitoring detects the problem.
Then observability helps investigate it:
Error Rate Increased
↓
Inspect Failed Trace
↓
Retrieval Failed
↓
Check Logs
↓
Vector Database Timeout
A simple way to remember the difference is:
| Monitoring | Observability |
| Is something wrong? | Why is it happening? |
| Detects problems | Investigates problems |
| Uses dashboards and alerts | Uses logs, metrics and traces |
Monitoring and observability work together.
Why AI applications need observability
Problems can happen at any stage.
A chatbot might give a wrong answer because it retrieved the wrong document.
A response might be slow because the LLM received too much context.
Costs might increase because a new prompt version sends thousands of unnecessary tokens.
An AI agent might fail because an external tool times out.
Observability helps engineers investigate these situations instead of guessing.
Logs, metrics and traces
The three core observability signals are logs, metrics and traces.
Logs: What happened?
Logs record individual events.
For example:
10:01:02 INFO Request received
10:01:03 INFO Retrieval started
10:01:04 WARNING Timeout
10:01:05 INFO Retry attempt 1
10:01:08 ERROR Retrieval failed
Good logs should include useful context such as:
timestamp
severity level
request ID
component
model name
error type
retry count
For example:
{ "request_id": "req_123", "component": "retriever", "error": "VectorDatabaseTimeout", "retry_count": 2}
The request ID is important because it helps connect information from different parts of the system.
Metrics: How is the system performing?
Metrics show overall system behavior.
For example:
Requests: 10,000
Error Rate: 12%
Average Latency: 3 seconds
p95 Latency: 14 seconds
Daily Cost: $1,400
Suppose ShopAssist processes 1,000 requests and 50 fail.
Error Rate = Failed Requests ÷ Total Requests × 100
50 ÷ 1,000 × 100 = 5%
So the error rate is 5%.
Average latency is calculated by dividing total request time by the number of requests.
If five requests take:
2s, 3s, 4s, 2s, 4s
The total is 15 seconds.
15 ÷ 5 = 3 seconds
So the average latency is 3 seconds.
But averages can hide slow requests.
That is why p95 latency is useful. If p95 latency is 12 seconds, approximately 95% of requests finish within 12 seconds, while the slowest requests take even longer.
Throughput measures completed work over time.
Completed Requests ÷ Elapsed Time
If the application completes 600 requests in 60 seconds:
600 ÷ 60 = 10 requests per second
AI applications should also track token usage and cost.
Suppose:
Input: 4,000 tokens at $0.002 per 1,000 tokens
Output: 1,000 tokens at $0.006 per 1,000 tokens
Input cost:
4 × $0.002 = $0.008
Output cost:
1 × $0.006 = $0.006
Total:
$0.014
Cost per successful task can also be useful.
If you spend $20 processing tasks and 80 are successful:
$20 ÷ 80 = $0.25
So each successful task costs $0.25.
Traces: Where did the problem happen?
A trace follows one request through the application.
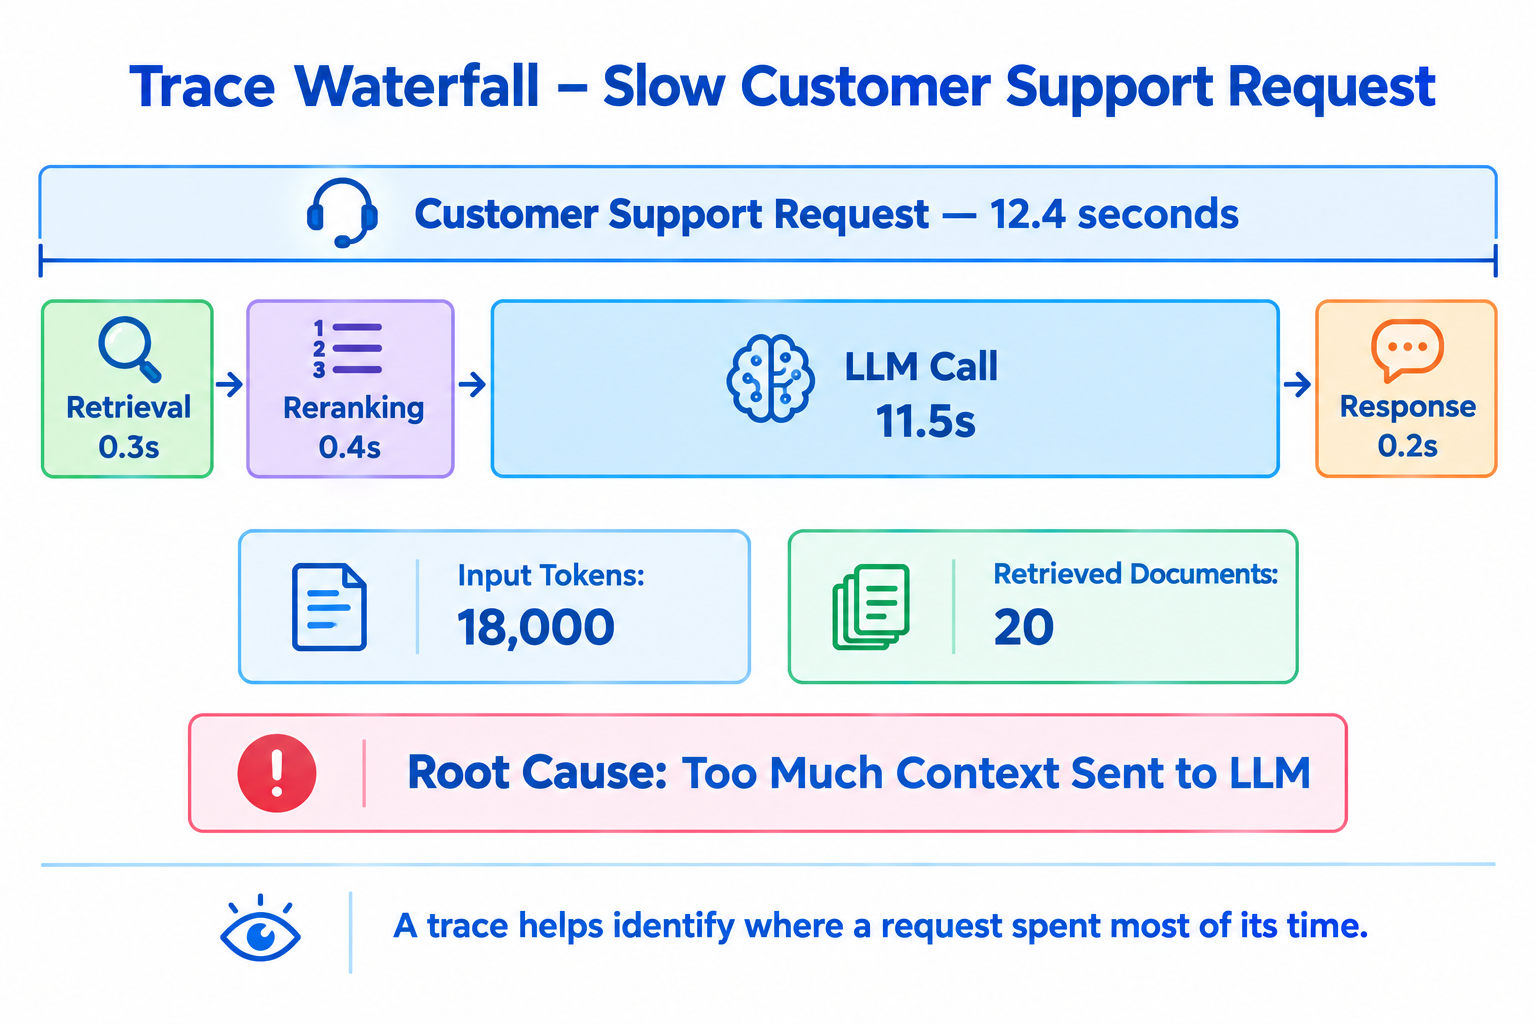
Imagine a customer request takes 12.4 seconds.
The trace shows:
Customer Request — 12.4s
│
├── Retrieval — 0.3s
├── Reranking — 0.4s
├── LLM Call — 11.5s
└── Response — 0.2s
Now we immediately know where the time was spent.
The problem is the LLM call.
Further inspection shows:
Input Tokens: 18,000
Retrieved Documents: 20
The application is sending too much context.
The fix could be:
Retrieve 20 Documents
↓
Rerank
↓
Select Top 5
↓
Send to LLM
A trace contains smaller operations called spans.
Each span has a start time and end time:
Duration = End Time − Start Time
image
How logs, metrics and traces work together
Suppose your dashboard shows:
Error Rate: 18%
You start with metrics because they tell you that something changed.
Next, you inspect failed traces:
Customer Request
│
├── Authentication
├── Retrieval
│ └── Timeout
└── LLM Call Not Executed
The trace tells you where the failure occurred.
Then you search the logs using the request ID:
Retrieval started
Timeout
Retry attempt 1
Timeout
Retry attempt 2
Retrieval failed
Now you have the complete picture:
Metrics → Detect the problem
Trace → Find where it happened
Logs → Understand what happened
AI-specific tracking
Traditional observability is not enough for AI applications.
You should also track:
- Prompt version
- Model name and settings
- Input and output tokens
- Retrieved documents
- Document versions
- Time to first token
- Tool calls
- Evaluation scores
Consider another scenario.
Your daily AI cost increases from:
$500
to:
$1,400
The number of users is unchanged.
Metrics show:
Token Usage: 3x Higher
You inspect traces:
Yesterday: Input Tokens = 2,000
Today: Input Tokens = 9,000
The metadata shows:
prompt_version = v3
The new prompt accidentally includes the entire conversation history.
The debugging process is:
Cost Increased
↓
Token Usage Increased
↓
Inspect Trace
↓
Prompt Version Changed
↓
Entire Conversation Included
↓
Root Cause Found
This is why prompt versions and token usage are important.
This is one of the most important things to understand about AI applications.
Your system might show:
API Healthy
Latency Normal
LLM Call Successful
But the answer can still be wrong.
For example:
Customer Question
↓
Retriever
↓
Wrong Document Retrieved
↓
LLM
↓
Wrong Answer
Telemetry tells us how the system behaved.
It does not automatically prove that the answer was correct.
AI applications also need quality signals such as:
1.Correctness
2.Relevance
3.Groundedness
4.User Feedback
5.Retrieval Quality
A healthy system and a high-quality AI system are not necessarily the same thing.
Dashboards and alerts
A production AI dashboard should help track:
Reliability
Request Volume
Error Rate
Success Rate
Performance
Average Latency
p95 Latency
Time to First Token
Cost
Token Usage
Cost per Request
Daily Cost
Cost per Successful Task
Alerts should notify the team when action is required.
For example:
Error Rate > 10%
p95 Latency > 8 seconds
Daily Cost Above Expected Budget
Too many alerts create alert fatigue, so alerts should focus on meaningful problems.
OpenTelemetry and LangSmith
OpenTelemetry and LangSmith can play different roles.
OpenTelemetry is a general observability framework for collecting telemetry such as:
- Logs
- Metrics
- Traces
It is useful when your AI application contains multiple services.
LangSmith focuses specifically on LLM application observability and can help inspect workflows involving:
Question
↓
Retrieval
↓
Prompt
↓
LLM
↓
Tool Calls
↓
Response
A simple way to think about them is:
| OpenTelemetry | LangSmith |
| General observability | LLM-focused observability |
| Distributed systems | AI workflows |
| Logs, metrics and traces | Prompts, models, retrieval and tools |
Depending on the system, teams may use both.
Common mistakes
The most common mistakes are:
Tracking only infrastructure
Your API can be healthy while your AI gives wrong answers.
Looking only at average latency
Average latency can hide slow requests, so track p95 latency too.
Not connecting telemetry
Use request IDs and trace IDs to connect logs and traces.
Not tracking prompt versions
Small prompt changes can affect quality, latency and cost.
Logging sensitive data
Avoid unnecessarily storing customer information, API keys or confidential content.
Collecting everything
Observability has costs. More logs and traces mean more storage and processing. Collect enough information to investigate problems without creating unnecessary overhead.
Deeper trace concepts: spans, parent-child relationships and context propagation
A trace represents one end-to-end request. A span represents one unit of work inside that request.
For a RAG application:
Customer Support Request
│
├── Retrieval
│ ├── Vector Search
│ └── Reranking
├── Prompt Construction
├── LLM Call
└── Response Generation
The top-level operation is the parent span. The operations underneath it are child spans.
Context propagation
In a distributed application, a request may move across an API service, retriever, vector database, model gateway and tool service.
A trace ID and span context allow those services to associate their work with the same request.
Service A
Customer Request
│
│ trace context
↓
Service B
Retriever
│
│ trace context
↓
Service C
LLM Gateway
OpenTelemetry uses context propagation to carry tracing context across service and process boundaries, commonly using W3C Trace Context headers.
How to read a trace
Start at the parent span and follow the child spans:
Customer Request — 12.4s
│
├── Retrieval — 0.3s
├── Reranking — 0.4s
├── LLM Call — 11.5s
└── Response — 0.2s
For a span:
Duration = End Time − Start Time
For example:
Start = 10:01:02.100
End = 10:01:02.400
Duration = 0.300 seconds
Why parallel spans cannot simply be added
Child spans may run sequentially or in parallel.
Retrieval ───────── 0.8s ───────>
Embedding ─── 0.5s ───>
│
└── parent continues
If two spans overlap, adding their durations double-counts the overlapping time. Use the actual start and end timestamps of the parent and child spans to understand wall-clock time.
Connecting logs, metrics and traces
A practical debugging workflow starts with a metric and then drills into a trace and its related logs.
Error Rate Spike
↓
Inspect Failed Trace
↓
Find Failed Span
↓
Use Request / Trace ID
↓
Read Related Logs
↓
Identify Root Cause
Example:
Metric:
Error Rate = 18%
Trace:
Customer Request
│
├── Authentication
├── Retrieval
│ └── Timeout
└── LLM Call Not Executed
Logs:
Retrieval started
Timeout
Retry attempt 1
Timeout
Retry attempt 2
Retrieval failed
The three signals tell one story:
Metrics → Detect the problem
Trace → Find where it happened
Logs → Understand what happened
Request IDs and trace IDs make it possible to correlate a failed request with its logs and spans.
AI-specific tracking
Traditional infrastructure telemetry is not enough for LLM applications. Useful AI-specific fields include:
- Prompt version
- Model name and settings
- Input and output tokens
- Retrieved documents
- Document versions
- Time to first token
- Tool calls
- Evaluation scores
Time to first token
Time to first token (TTFT) measures how long the user waits before the model begins producing output.
Track TTFT separately from total latency:
User Request
│
├── Retrieval
├── Prompt construction
├── LLM processing
│ ↑
│ TTFT
└── Full response
Telemetry does not prove answer correctness
A trace can show:
API call succeeded
Latency = normal
LLM call = successful
while the answer is still wrong.
AI quality also needs signals such as correctness, relevance, groundedness, user feedback, retrieval quality and evaluation scores.
Telemetry → How the system behaved
Evaluation → How good the AI result was
Observability tools: OpenTelemetry, LangSmith and Langfuse
OpenTelemetry
OpenTelemetry is a general observability framework for generating and collecting telemetry such as traces, metrics and logs.
Application
↓
OpenTelemetry instrumentation
↓
Traces / Metrics / Logs
↓
Collector / Observability backend
It is useful when an AI application contains multiple services and you want a vendor-neutral telemetry layer.
LangSmith
LangSmith provides LLM-focused tracing and monitoring. It can capture workflows involving retrieval, prompts, model calls and tool calls.
Question
↓
Retrieval
↓
Prompt
↓
LLM
↓
Tool Calls
↓
Response
Langfuse
Langfuse is another LLM-focused observability platform. It supports tracing for LLM and non-LLM operations, including retrieval, embeddings, API calls and model generations.
Its Python SDK supports nested observations so a parent request can contain child spans or generations.
User Request
│
├── Retrieval
├── Reranking
├── LLM Generation
└── Response
Langfuse is OpenTelemetry-based and supports native SDKs, integrations and OpenTelemetry instrumentation.
Simple comparison
| Tool | Main role | Useful for |
| OpenTelemetry | General telemetry framework | Distributed traces, metrics and logs |
| LangSmith | LLM-focused observability | LLM traces, prompts, tools, mondebuggitoring and evaluation |
| Langfuse | LLM-focused observability | LLM traces, retrieval, generations, prompts and evaluation |
Teams can use OpenTelemetry together with an LLM-focused platform when they need both distributed-system visibility and detailed AI workflow visibility.
Practical Python walkthrough: instrument a small RAG application
The goal is to reproduce a realistic production debugging workflow:
Question
↓
Retriever
↓
Reranker
↓
LLM
↓
Answer
Step 1: Create a tiny knowledge base
documents = [
{"id": "policy-v1", "text": "Returns are accepted within 30 days."},

    {"id": "policy-v2", "text": "Returns are accepted within 60 days."},

]
Suppose policy-v2 is the current policy, but the retriever accidentally selects policy-v1.
Step 2: Instrument the pipeline
from opentelemetry import trace
tracer = trace.get_tracer("shopassist")
def answer_question(question):

    with tracer.start_as_current_span("customer-request"):
        with tracer.start_as_current_span("retrieval") as span:
         document = retrieve(question)
            span.set_attribute("[document.id](https://document.id)", document["id"])
                  with tracer.start_as_current_span("llm-call"):

            prompt = (

                "Answer the customer using this document:"

                f"{document['text']}
"

                f"Question: {question}"

            )

            answer = call_llm(prompt)

 return answer
The hierarchy is:
customer-request
├── retrieval
└── llm-call
Step 3: Introduce the retrieval failure
Ask:
Can I return my headphones after 45 days?
The retriever returns:
policy-v1
Returns are accepted within 30 days.
The LLM may correctly follow the supplied context and answer that the return is not allowed. The model call succeeded, but the application produced the wrong business answer because retrieval selected an outdated document.
Step 4: Inspect the trace
Customer Request
│
├── Retrieval
│ └── document.id = policy-v1
│
└── LLM Call
└── prompt contains 30-day policy
Inspect AI metadata:
Prompt Version: v2
Retrieved Documents: policy-v1
Model: <model name>
Input Tokens: <token count>
Tool Calls: 0
The root cause is the retrieved document.
Step 5: Fix retrieval
Retrieve candidates
↓
Rerank
↓
Prefer current document version
↓
policy-v2
↓
LLM
The new trace should show:
Retrieved Document: policy-v2
Step 6: Verify the fix
Verification should include both system telemetry and AI quality:
Trace:
Retrieval succeeded
Metadata:
Retrieved Document = policy-v2
Latency:
Within expected threshold
Quality:
Answer is correct and grounded in policy-v2
The debugging loop is:
Detect → Trace → Inspect → Fix → Verify
Production considerations
Dashboards
A useful production dashboard should include:
Reliability
- Request volume
- Error rate
- Success rate
Performance
- Average latency
- p95 latency
- Time to first token
Cost
- Token usage
- Cost per request
- Daily cost
- Cost per successful task
AI quality
- Evaluation scores
- Retrieval quality
- User feedback
- Groundedness or correctness signals
Alert thresholds
Examples:
Error Rate > 10%
p95 Latency > 8 seconds
Daily Cost > Expected Budget
TTFT > Expected Threshold
Evaluation Score < Minimum Threshold
Too many alerts create alert fatigue, so alerts should focus on actionable problems.
Sampling
High-volume applications may not need every trace at full detail.
A practical policy might keep:
100% of errors
100% of slow requests
100% of important evaluation cases
A sampled percentage of normal traffic
Sampling can reduce storage and processing costs.
Retention
Define how long metrics, logs, traces, prompts and evaluation results should be retained. Longer retention increases storage and privacy exposure.
Sensitive-data redaction
AI traces can contain customer questions, retrieved documents, prompts and model outputs.
Avoid unnecessarily storing:
- Customer personal information
- API keys
- Authentication tokens
- Confidential business data
- Sensitive document contents
Redact or filter sensitive fields before exporting telemetry when possible.
Observability overhead
More spans, larger payloads, frequent exports and longer retention can increase CPU usage, network traffic, storage, vendor costs and application complexity.
The goal is not to collect everything. Collect enough information to answer:
What happened?
Where did it happen?
Why did it happen?
How long did it take?
Was the answer correct?
Debugging workflow
Dashboard Alert
↓
Check Metrics
↓
Open Trace
↓
Inspect Failed / Slow Span
↓
Read Related Logs
↓
Check AI Metadata
↓
Find Root Cause
↓
Fix
↓
Verify
↓
Problem Resolved
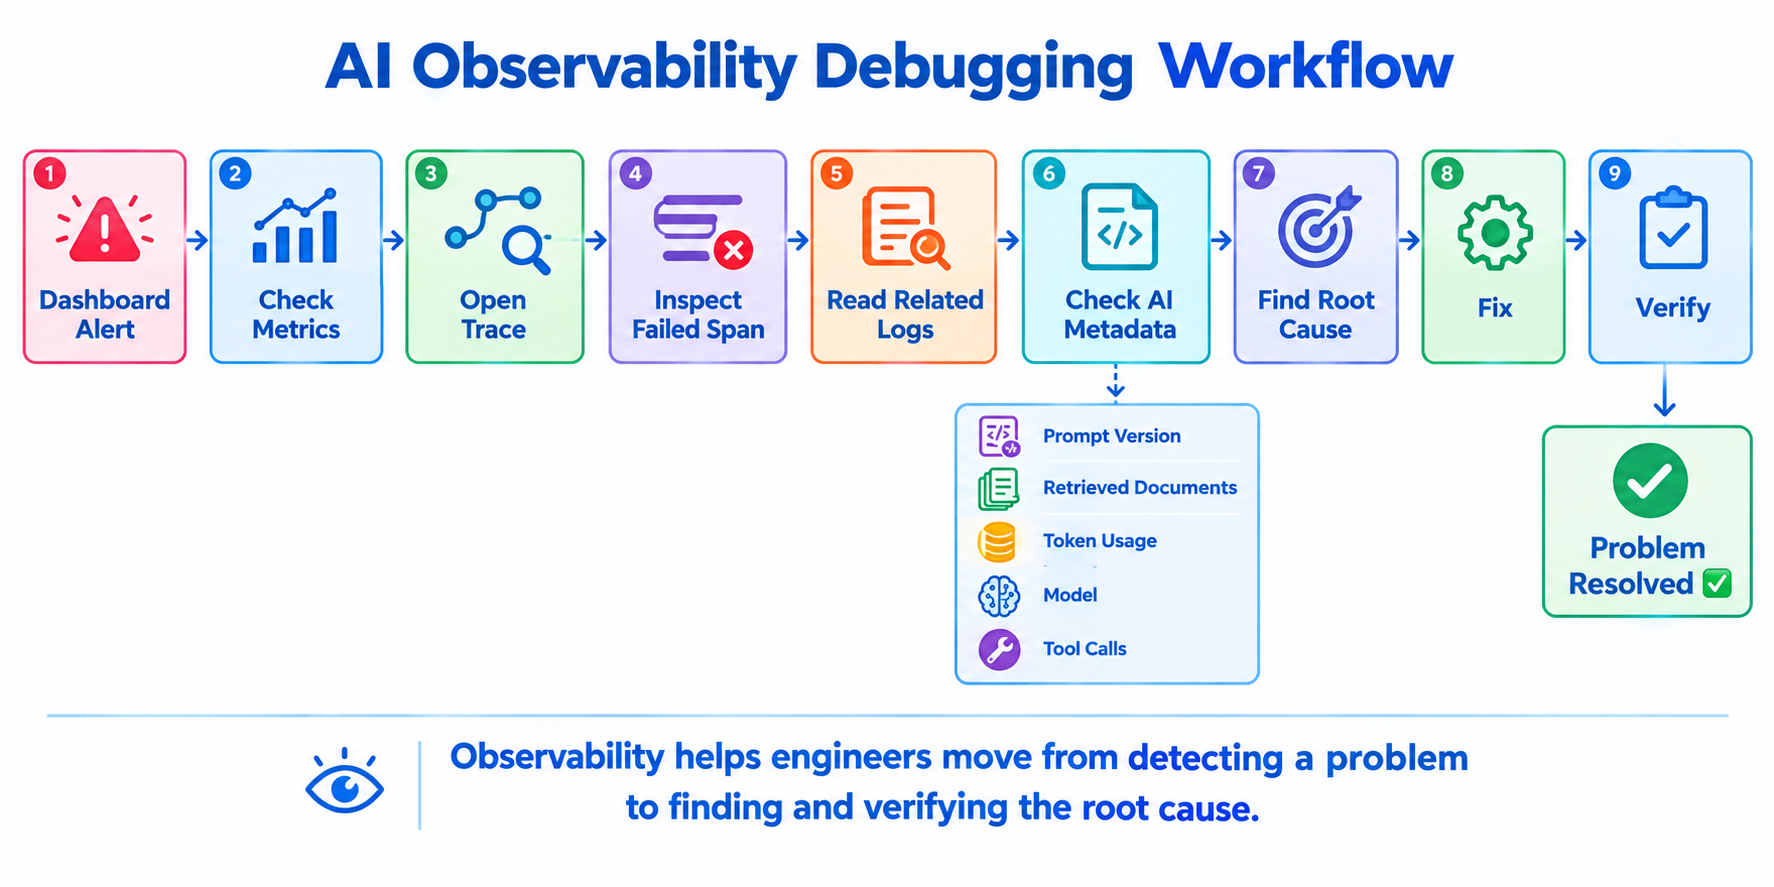
For AI applications, Check AI Metadata should include:
Prompt Version
Retrieved Documents
Token Usage
Model
Tool Calls
Time to First Token
Evaluation Score
Final checklist
Before deploying an LLM application, make sure you can answer:
Logs
- What happened?
- Which request failed?
- Did retries occur?
Metrics
- Is error rate increasing?
- Are requests getting slower?
- Is token usage increasing?
- Is cost increasing?
Traces
- Where did the request spend time?
- Which component failed?
- Which span is slow?
AI-specific data
- Which prompt version was used?
- Which model was used?
- Which documents were retrieved?
- How many tokens were used?
- Did the AI answer correctly?
Conclusion
When an AI application fails, guessing is expensive.
AI observability gives you a systematic way to investigate problems.
Metrics
↓
Detect the problem
Traces
↓
Find where it happened
Logs
↓
Understand what happened
AI Metadata
↓
Find the root cause
The most important lesson is simple:
A successful API request does not guarantee a correct AI answer.
Your servers can be healthy, your LLM call can succeed, and your chatbot can still give the wrong answer.
That is why production AI applications need visibility into both system performance and AI quality.
AI observability helps engineers move from:
Something went wrong, but I don't know why.
To:
I can see where the problem happened, understand what caused it, and verify the fix.